
Konu: Görüntü İşleme dersinde yapılan örnekler, verilen ödevler ve uygulama örnekleri...
Cevap: Anaconda(Jupyter Notebook), Visual Studio Code, PyCharm, Wingware, Sublime Text
Ödev2: Telefonlarda kullanılan 5 adet görüntü işleme programı yazınız.
Cevap: Prisma(Instagram), Snapseed(Google), PhotoGrid, PicsArt, FotoRus
Ödev3: Python'da rasgele bir dizi üretip, dizide geçen elemanların sayısını (frekans) ekrana yazdırın.
Cevap: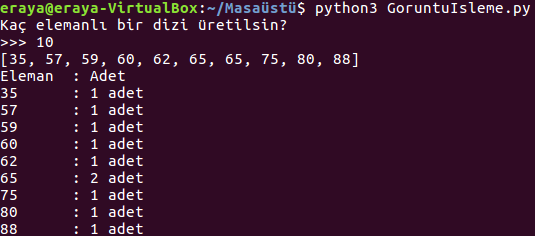
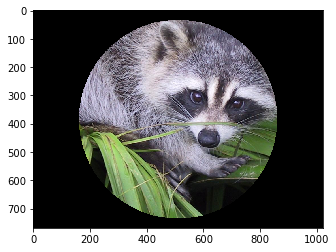
Ödev4: Görüntü işleme için kullanılan kütüphaneler (numpy,matplotlib gibi) yardımıyla bilgisayarda bulunan bir resim dosyasını açıp, resim daire olacak şekilde kırpılacak ve dairenin dışında kalan alan beyaz olacaktır. En son bu görüntüyü ekrana bastırın.
Cevap: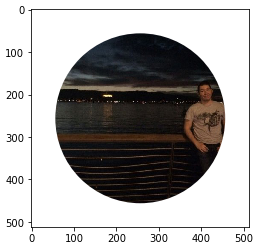
Ödev5:
1- 25 adet resim üretilecek ve ekranda görüntülecek.
2- Görüntülenen resimler siyah-beyaz'a dönüştürülecek.
3- reshape fonksiyonu ile resim boyutu vektöre dönüştürülecek. Matris 100x100 ise 1x10000 olacak.
4- center fonksiyonu ile a b c d e değerlerini kıyaslayıp harf grupları belirlenecek.
5- Test. Bir resim dosyası harf grupları ile kıyaslanacak ve hangi harf olduğunu söylenecek.
Cevap: Kodlar için tıklayın.
Ödev6:
1- Bir adet nesnelerden oluşan resim üretilecek ve ekranda görüntülecek.
2- Görüntülenen resim siyah-beyaz'a dönüştürülecek.
3- Resim içerisinde kaç adet nesne bulunduğu ekrana yazdırılacak.
Cevap: Kodlar için tıklayın.
Ödev7:
1- imread ile resim okunacak.
2- Resim dosyası sırasıyla jpg -> graylevel -> BlackWhite dönüştürülecek.
3- Spacity - Matrix oluşturacak Vect class'ı oluşturulacak. (Type: Dictionary)
Cevap: Kodlar için tıklayın.
Ödev8:
1- imread ile resim okunacak.
2- Resim dosyası BlackWhite'a dönüştürülecek.
3- Mask yardımı ile Dilation(Genişletme) işlemi yapılacak.
Cevap: Kodlar için tıklayın.


ÖDEVLER
Cevap: Anaconda(Jupyter Notebook), Visual Studio Code, PyCharm, Wingware, Sublime Text
Ödev2: Telefonlarda kullanılan 5 adet görüntü işleme programı yazınız.
Cevap: Prisma(Instagram), Snapseed(Google), PhotoGrid, PicsArt, FotoRus
Ödev3: Python'da rasgele bir dizi üretip, dizide geçen elemanların sayısını (frekans) ekrana yazdırın.
Cevap:
    #!/usr/bin/python
    import random
    sayac = 0
    dizi = []
    sayi = int(input("Kaç elemanlı bir dizi üretilsin?\n>>> "))

    while(sayac < sayi):
        a = random.randint(0,100)
        dizi.append(a)
        sayac += 1

    dizi.sort()
    print(dizi)
    print("Eleman  : Adet")

    adet = 0
    for i in range(sayi):
        adet = 1
        for j in range(i, sayi-1):
            if(dizi[i] == dizi[j+1] and (dizi[i] != -1 or dizi[j+1] != -1)):
                adet += 1
                dizi[j+1] = -1
        if(dizi[i] != -1):
                print(dizi[i], "\t:", adet, "adet")
Ödev4: Görüntü işleme için kullanılan kütüphaneler (numpy,matplotlib gibi) yardımıyla bilgisayarda bulunan bir resim dosyasını açıp, resim daire olacak şekilde kırpılacak ve dairenin dışında kalan alan beyaz olacaktır. En son bu görüntüyü ekrana bastırın.
Cevap:
    import matplotlib.pyplot as plt
    import matplotlib.patches as patches
    import matplotlib.cbook as cbook

    with cbook.get_sample_data('C:\\Users\eraya\Desktop\p.jpg') as image_file:
        image = plt.imread(image_file)

    fig, ax = plt.subplots()
    im = ax.imshow(image)
    patch = patches.Circle((256, 256), radius=200, transform=ax.transData)
    im.set_clip_path(patch)

    ax.axis('on')
    plt.show()
Ödev5:
1- 25 adet resim üretilecek ve ekranda görüntülecek.
2- Görüntülenen resimler siyah-beyaz'a dönüştürülecek.
3- reshape fonksiyonu ile resim boyutu vektöre dönüştürülecek. Matris 100x100 ise 1x10000 olacak.
4- center fonksiyonu ile a b c d e değerlerini kıyaslayıp harf grupları belirlenecek.
5- Test. Bir resim dosyası harf grupları ile kıyaslanacak ve hangi harf olduğunu söylenecek.
Cevap: Kodlar için tıklayın.
Ödev6:
1- Bir adet nesnelerden oluşan resim üretilecek ve ekranda görüntülecek.
2- Görüntülenen resim siyah-beyaz'a dönüştürülecek.
3- Resim içerisinde kaç adet nesne bulunduğu ekrana yazdırılacak.
Cevap: Kodlar için tıklayın.
Ödev7:
1- imread ile resim okunacak.
2- Resim dosyası sırasıyla jpg -> graylevel -> BlackWhite dönüştürülecek.
3- Spacity - Matrix oluşturacak Vect class'ı oluşturulacak. (Type: Dictionary)
Cevap: Kodlar için tıklayın.
Ödev8:
1- imread ile resim okunacak.
2- Resim dosyası BlackWhite'a dönüştürülecek.
3- Mask yardımı ile Dilation(Genişletme) işlemi yapılacak.
Cevap: Kodlar için tıklayın.
HAFTA - 1 (28 Eylül 2017 Perşembe)
import math
def findDistance(p0,p1):
return math.sqrt(((p0[0]-p1[0])**2)+((p0[1]-p1[1])**2))
d = findDistance([3,0],[0,4])
d #5.0
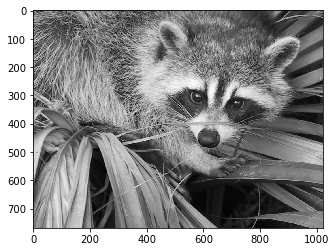
from scipy import ndimage
from scipy import misc
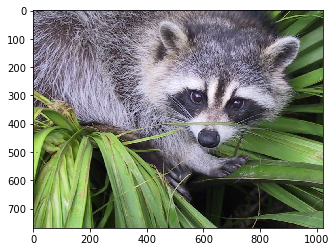
f = misc.face()
import matplotlib.pyplot as plt
plt.imshow(f)
plt.show()
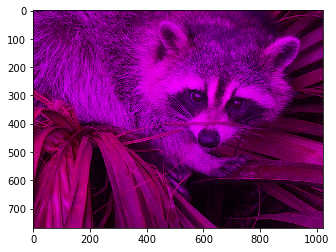
f.ndim #3

f.shape #(768, 1024, 3)

type (f) #numpy.ndarray

f[:,:,1] = 0
plt.imshow(f)
plt.show()
type (f.shape) #tuple
im_size = f.shape
im_size[0] #768

center = [im_size[0]/2, im_size[1]/2]
center #[384.0, 512.0]

from scipy import ndimage
from scipy import misc
f = misc.face()
import matplotlib.pyplot as plt

for i in range(im_size[0]):
    for j in range(im_size[1]):
        if (findDistance([i,j], center)>350):
            f[i,j,:] = 0, 0, 0

plt.imshow(f)
plt.show()
HAFTA - 2 (5 Ekim 2017 Perşembe)
import matplotlib.pyplot as plt
import matplotlib.image as mpimg
import numpy as np

img=mpimg.imread(r'c:\stinkbug.png')
img.ndim #3
img.shape #(375,500,3)

plt.imshow(img)
plt.show()
img[:,100,:].max() #0.627451

img_1=img[1:375:2,:,:] #1:375:2 -> x bileşeni için 1'den 375'e kadar ikişer artarak git.

img_1=img[:,1:500:2,:] #1:500:2 -> y bileşeni için 1'den 500'e kadar ikişer artarak git.

#plt.subplot(1,2,1), plt.imshow(img)
#plt.subplot(1,2,2), plt.imshow(img_1)

plt.imshow(img_1)
plt.show()
img.ndim, img.shape #(3, (375, 500, 3))

img_20=np.zeros((500,375,3))
img_20.shape #(500, 375, 3)
#img ile img_20 birbirinin transpozu değerler olmalıdır.

for i in range(375):
    for j in range(500):
        img_20[j,i,:]=img[i,j,:] #x ve y'ye göre transpoz işlemidir.
        #print(img[i,j,:]) #Bu döngü resimdeki bütün RGB değerlerini verir.

img_30=np.zeros((500,375,3))
img_30.shape

for i in range(375):
    for j in range(500):
        img_30[j,i,:]=1-img[i,j,:] #Resmin negatifini alır.

img_40=np.zeros((375,500,3))
img_40.shape

for i in range(375):
    for j in range(500):
        img_40[375-i-1,50-j-1,:]=img[i,j,:] #Resmin x ve y'ye göre simetriği yani orjine göre ayna görüntüsünü alır.

plt.subplot(1,4,1),plt.imshow(img)
plt.subplot(1,4,2),plt.imshow(img)
plt.subplot(1,4,3),plt.imshow(img)
plt.subplot(1,4,4),plt.imshow(img)
def createList(size):
    myList=[]
    for i in range(size):
        myList.append(i)
    return myList

def listIncrement(l,n):
    myL=[]
    for i in range(len(l)):
        myL.append(l[i]+n) #l[i]=l[i]+n
    return l

L_1=createList(5)
L_1
L_2=listIncrement(L_1,5)
L_2 #[0, 1, 2, 3, 4]

#%timeit -> Fonksiyonun çalışma zamanı
#createList(1000)

#1000 adet eleman oluşturmayı 236 milisaniyede yapıyor.
%timeit myL_1=listIncrement(createList(1000),50)
#1000 loops, best of 3: 236 µs per loop

#1000 adet eleman oluşturmayı 2.95 milisaniyede yapıyor.
%timeit np.arange(1000)+1
#The slowest run took 10.45 times longer than the fastest. This could mean that an intermediate result is being cached.
100000 loops, best of 3: 2.95 µs per loop

import numpy as np
size=10
my_10=np.arange(size)
my_10 #array([0, 1, 2, 3, 4, 5, 6, 7, 8, 9])
my_10+1 #array([ 1,  2,  3,  4,  5,  6,  7,  8,  9, 10])
HAFTA - 3 (12 Ekim 2017 Perşembe)
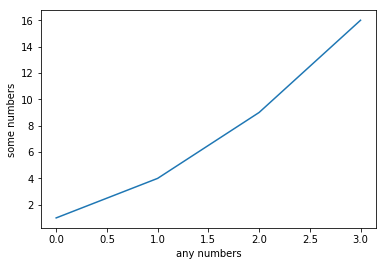
import matplotlib.pyplot as plt
plt.plot([1,4,9,16])
plt.xlabel('any numbers')
plt.ylabel('some numbers')
plt.show()
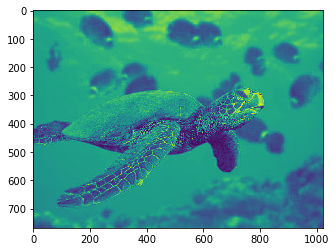
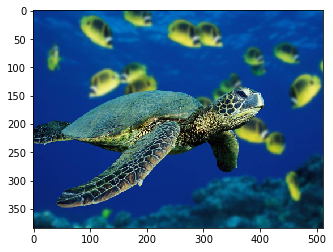
import matplotlib.pyplot as plt
import numpy as np
img_1=plt.imread("test.jpg")

img_1.ndim, img_1.shape #(3, (768, 1024, 3))

plt.imshow(img_1[:,:,2] + 10)
plt.show()
#pixel_1_rgb=[0,0,0]
#pixel_1_gray_level=0
#pixel_1_rgb=[10,0,0]
#pixel_1_gray_level=10
#pixel_1_rgb=[0,10,0]
#pixel_1_gray_level=10
#pixel_1_rgb=[10,10,10]
#pixel_1_gray_level=12
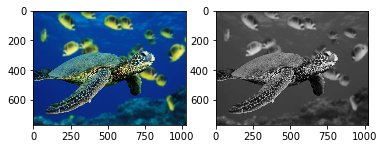
def convertRGBPixelToGrayLevel(RGB_Pixel):
return RGB_Pixel[0]/3 + RGB_Pixel[1]/3 + RGB_Pixel[2]/3
convertRGBPixelToGrayLevel([2,5,7]) #4.666666666666667
img_2=np.zeros((img_1.shape[0],img_1.shape[1]))
img_2.shape #(768, 1024)
for i in range(img_1.shape[0]):
for j in range(img_1.shape[1]):
img_2[i,j]=convertRGBPixelToGrayLevel(img_1[i,j,:])
plt.subplot(1,2,1)
plt.imshow(img_1)
plt.subplot(1,2,2)
plt.imshow(img_2, cmap='gray')
plt.show()
from scipy.misc import imsave
imsave('test_2.jpg',img_2)
#Bulunduğumuz klasöre test_2.jpg adlı bir resim dosyası oluşturuldu.
import matplotlib.pyplot as plt
from scipy.misc import imsave
def convertRGB_To_GrayLevel(image_1):
    img_1=plt.imread(image_1)
    img_2=np.zeros((img_1.shape[0],img_1.shape[1]))
    for i in range(img_1.shape[0]):
        for j in range(img_1.shape[1]):
            img_2[i,j]=img_1[i,j,0]/3 + img_1[i,j,1]/3 + img_1[i,j,2]/3
    imsave(str(image_1)+".jpg",img_2)
    plt.subplot(1,2,1)
    plt.imshow(img_1)
    plt.subplot(1,2,2)
    plt.imshow(img_2, cmap='gray')
    plt.show()
convertRGB_To_GrayLevel('test.jpg')
img_1=plt.imread('var.jpg')
img_2=plt.imread('yok.jpg')
plt.imshow(img_2-img_1)
plt.show()
HAFTA - 4 (19 Ekim 2017 Perşembe)
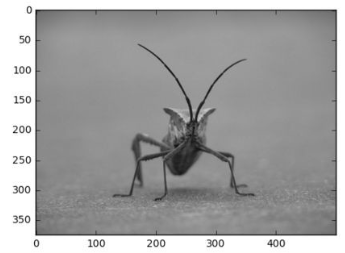
from scipy import misc
f = misc.face(gray=True)
import matplotlib.pyplot as plt
plt.imshow(f, cmap=plt.cm.gray)
plt.show()
import matplotlib.pyplot as plt
import numpy as np
#pwd
#ls *.jpg
img_1=plt.imread("C:\\Users\\eraya\\Desktop\\JupyterExample\\test.jpg")
img_1.ndim
img_1.shape
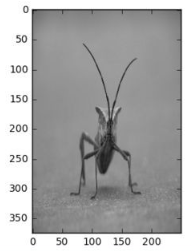
img_2=img_1[1:768:2,1:1024:2]
img_2.ndim
img_2.shape
plt.imshow(img_2)
plt.show()
img_3=np.zeros((img_2.shape[0:2]))
img_3.shape #(384, 512)

img_4=np.zeros((img_2.shape[0:2]))
img_4.shape #(384, 512)

for i in range(img_2.shape[0]): #384
    for j in range(img_2.shape[1]): #512
        n=img_2[i,j,0]/3+img_2[i,j,1]/3+img_2[i,j,2]/3
        img_3[i,j]=n
        if n>100:
            img_4[i,j]=255
        else:
            img_4[i,j]=0
img_3.shape
#plt.imshow(img_3,plt.cm.gray)
plt.imshow(img_4,plt.cm.gray)
plt.show()
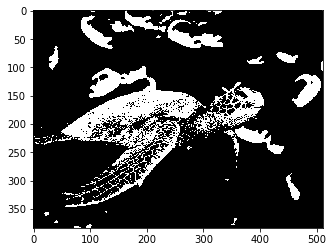
threshold=80
for i in range(img_2.shape[0]): #384
for j in range(img_2.shape[1]): #512
n=img_2[i,j,0]/3+img_2[i,j,1]/3+img_2[i,j,2]/3
img_3[i,j]=n
if n>threshold:
img_4[i,j]=255
else:
img_4[i,j]=0
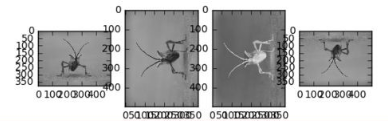
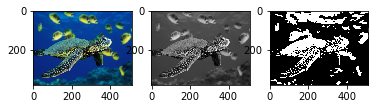
plt.subplot(1,3,1), plt.imshow(img_2)
plt.subplot(1,3,2), plt.imshow(img_3,plt.cm.gray)
plt.subplot(1,3,3), plt.imshow(img_4,plt.cm.binary)
plt.imshow(img_4,plt.cm.gray)#Derste gray->binary yapıldı ama tahtadaki ekran görüntüsü aynı.
plt.show()
import matplotlib.pyplot as plt
import numpy as np
#pwd
#ls *.jpg
img_1=plt.imread("C:\\Users\\eraya\\Desktop\\JupyterExample\\ekrangoruntusu.png")
img_1.ndim
img_1.shape #(374, 994, 4)
#img_2=img_1[1:768:2,1:1024:2]

img_2=img_1
img_4=np.zeros((img_2.shape))

img_5=img_1
img_5=np.zeros((img_2.shape[0:2]))
img_5.shape #(374, 994)
threshold=0
for i in range(img_2.shape[0]): #384
    for j in range(img_2.shape[1]): #512
        n=img_2[i,j,0]/3+img_2[i,j,1]/3+img_2[i,j,2]/3
        if n>threshold:
            img_5[i,j]=255
        else:
            img_5[i,j]=0

plt.subplot(1,2,1), plt.imshow(img_2)
plt.subplot(1,2,2), plt.imshow(img_5,plt.cm.binary)

#plt.imshow(img_5,plt.cm.binary)#Derste gray->binary yapıldı ama tahtadaki ekran görüntüsü aynı.
plt.show()
img_2.ndim, img_2.shape, img_2.mean()
#(3, (374, 994, 4), 0.94397408)
img_1 = plt.imread('C:\\Users\\eraya\\Desktop\\JupyterExample\\adsiz.jpg')
img_1.ndim,img_1.shape
img_5=np.zeros((img_1.shape[0:2]))
img_2=img_1
img_2.shape,img_5.shape

threshold=0
for i in range(img_2.shape[0]): #384
    for j in range(img_2.shape[1]): #512
        n=img_2[i,j,0]/3+img_2[i,j,1]/3+img_2[i,j,2]/3
        if n>threshold:
            img_5[i,j]=255
        else:
            img_5[i,j]=0

plt.subplot(1,2,1), plt.imshow(img_2)
plt.subplot(1,2,2), plt.imshow(img_5,plt.cm.binary)

#plt.imshow(img_5,plt.cm.binary)#Derste gray->binary yapıldı ama tahtadaki ekran görüntüsü aynı.
plt.show()
HAFTA - 5 (26 Ekim 2017 Perşembe)
myPoint_1 = [0,0]
myPoint_2 = [1,0]
myPoint_3 = [0,1]
myPoint_4 = [1,1]

import math
def uzaklik():
    value=(myPoint_1[0]-myPoint_2[0])**2 + (myPoint_1[1]-myPoint_2[1])**2
    return value
d_1_2 = math.sqrt(uzaklik())
d_1_2 #1.0
#İki vektör arasındaki uzaklığı bulan fonksiyon.
import math
def myDistance(a,b):
    myPoint_1=a
    myPoint_2=b
    a=(myPoint_1[0]-myPoint_2[0])**2
    b=(myPoint_1[1]-myPoint_2[1])**2
    return math.sqrt(a+b)

myPoint_1 = [0,0]
myPoint_2 = [1,0]
myPoint_3 = [0,1]
myPoint_4 = [1,1]

myDistance(myPoint_2,myPoint_3) #1.4142135623730951
#İki noktanın orta noktası bulundu.
a=myPoint_1[0]+myPoint_2[0]+myPoint_3[0]+myPoint_4[0]
b=myPoint_1[1]+myPoint_2[1]+myPoint_3[1]+myPoint_4[1]
centerPoint=[a/4,b/4]
centerPoint #[0.5, 0.5]
def findCenter(List_Of_Points):
    a=0
    b=0
    for point in List_Of_Points:
        a=a+point[0]
        b=b+point[1]
    l=len(List_Of_Points)
    return [a/l,b/l]

myPoint_1 = [0,0]
myPoint_2 = [1,0]
myPoint_3 = [0,1]
myPoint_4 = [1,1]

my_Point_List=[]
my_Point_List.append(myPoint_1)
my_Point_List.append(myPoint_2)
my_Point_List.append(myPoint_3)
my_Point_List.append(myPoint_4)

len(my_Point_List) #4

center=findCenter(my_Point_List)
center #[0.5, 0.5]
import numpy as np
my_Array=np.array([[1,2,3],[2,6,9]],np.int32)
my_Array.ndim, my_Array.shape
my_Array_1=my_Array.reshape(1,6)
print(my_Array)
print("")
print(my_Array_1)

#[[1 2 3]
# [2 6 9]]
#
#[[1 2 3 2 6 9]]
HAFTA - 6 (2 Kasım 2017 Perşembe)
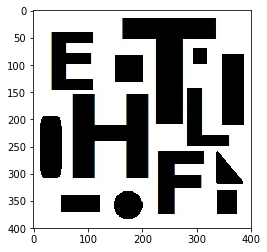
# T harfi için

# 0: Black
# 1: White

# of edge: 8
# of corner: 8

# External 1 0 veya 0 1 veya 0 0 veya 0 0
#          0 0      0 0      1 0      0 1

# Internal 0 1 veya 1 0 veya 1 1 veya 1 1
#          1 1      1 1      0 1      1 0
internal_mask_1=[[1,0],[0,0]]
internal_mask_2=[[0,1],[0,0]]
internal_mask_3=[[0,0],[1,0]]
internal_mask_4=[[0,0],[0,1]]

external_mask_1=[[0,1],[1,1]]
external_mask_2=[[1,0],[1,1]]
external_mask_3=[[1,1],[0,1]]
external_mask_4=[[1,1],[1,0]]

internal_mask_list=[internal_mask_1,internal_mask_2,internal_mask_3,internal_mask_4]
external_mask_list=[external_mask_1,external_mask_2,external_mask_3,external_mask_4]
import numpy as np
import matplotlib.pyplot as plt
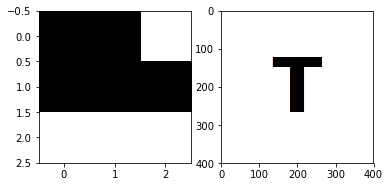
size=3
#-------------------Random Image-------------------
img_1=np.random.randint(0,2,(size,size))
#img_1 -> fake image, you should read from a file
plt.subplot(1,2,1), plt.imshow(img_1,cmap='Greys',interpolation='nearest')
#---------------------My Image---------------------
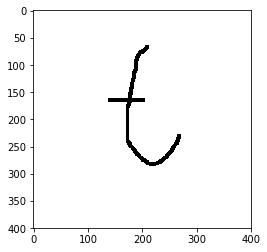
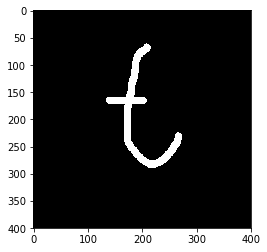
img=plt.imread("C:\\Users\\eraya\\Desktop\\JupyterExample\\t-harfi.jpg")
plt.subplot(1,2,2), plt.imshow(img,cmap='Greys',interpolation='nearest')
plt.show()
def count_mask(image,mask):
    # input:
    # image m*n black-white image
    # mask 2*2 mask
    #
    counter=0
    m,n=image.shape
    for i in range(m-1):
        for j in range(n-1):
            a=b=c=d=False
            if(image[i,j] == mask[0][0]):
                a=True
            if(image[i,j+1] == mask[0][1]):
                b=True
            if(image[i+1,j] == mask[1][0]):
                c=True
            if(image[i+1,j+1] == mask[1][1]):
                d=True
            if(a and b and c and d):
                counter=counter+1
    return counter
def count_internal_mask(image):
    counter_internal=0
    for mask in internal_mask_list:
        counter_internal=counter_internal+count_mask(img_1,mask)
    return counter_internal

def count_external_mask(image):
    counter_external=0
    for mask in external_mask_list:
        counter_external=counter_external+count_mask(img_1,mask)
    return counter_external
c_1=count_internal_mask(img_1) # Köşe sayısı
c_2=count_external_mask(img_1) # Köşe içinde kalan alan
c_1, c_2 #(0,1)
# T harfini içeren resim için çıktı.
import math
abs(c_1-c_2)/4 #0.25
import matplotlib.pyplot as plt
import numpy as np
import math
from scipy.misc import imsave
%matplotlib inline

def convert_RGB_to_gray_level(image_1):
    img_1=plt.imread(image_1)
    img_2=np.zeros((img_1.shape[0],img_1.shape[1]))
    for i in range(img_2.shape[0]):
        for j in range(img_2.shape[1]):
            img_2[i,j]=img_1[i,j,0]/3+img_1[i,j,1]/3+img_1[i,j,2]/3
    # print(img_1.shape)
    return img_2

def convert_RGB_to_monochrome_BW(image_1,threshold=100):
    img_1=plt.imread(image_1)
    img_2=np.zeros((img_1.shape[0],img_1.shape[1]))
    for i in range(img_2.shape[0]):
        for j in range(img_2.shape[1]):
            if (img_1[i,j,0]/3+img_1[i,j,1]/3+img_1[i,j,2]/3)>threshold:
                # img_2[i,j]=img_1[i,j,0]/3+img_1[i,j,1]/3+img_1[i,j,2]/3
                img_2[i,j]=1
            else:
                img_2[i,j]=0
    # print(img_1.shape)
    return img_2

def create_mask_internal():
    i_m_1=np.array([[1,0],[0,0]])
    i_m_2=np.array([[0,1],[0,0]])
    i_m_3=np.array([[0,0],[1,0]])
    i_m_4=np.array([[0,0],[0,1]])
    i_m_l=[i_m_1,i_m_2,i_m_3,i_m_4]
    return i_m_l

def create_mask_external():
    e_m_1=np.array([[0,1],[1,1]])
    e_m_2=np.array([[1,0],[1,1]])
    e_m_3=np.array([[1,1],[0,1]])
    e_m_4=np.array([[1,1],[1,0]])
    e_m_l=[e_m_1,e_m_2,e_m_3,e_m_4]
    return e_m_l

def count_object(image_name_with_path,threshold=150):
    img_file_1=image_name_with_path
    img_file_2=convert_RGB_to_gray_level(img_file_1)
    img_file_3=convert_RGB_to_monochrome_BW(img_file_1,threshold)
    image=img_file_3
    c_1=0
    c_2=0
    m,n=image.shape
    for i in range(m-1):
        for j in range(n-1):
            for mask in create_mask_internal():
                if False not in (img_file_3[i:i+2,j:j+2]==mask):
                    #print("e mask bulundu")
                    c_1=c_1+1
            for mask in create_mask_external():
                if False not in (img_file_3[i:i+2,j:j+2]==mask):
                    #print("i mask bulundu")
                    c_2=c_2+1
    number_of_objects=math.fabs((c_2-c_1)/4)
    print("Resimdeki Toplam T Sayısı:", number_of_objects)
    return number_of_objects
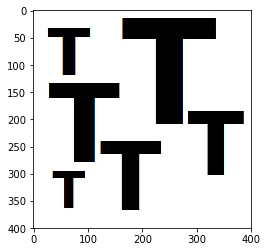
image_file_1=r"C:\\Users\\eraya\\Desktop\\JupyterExample\\test_t.jpg"
count_object(image_file_1)

# Resimdeki Toplam T Sayısı: 6.0
# 6.0
image_file_2=r"C:\\Users\\eraya\\Desktop\\JupyterExample\\test_karisik.jpg"
count_object(image_file_2)

# Resimdeki Toplam Nesne Sayısı: 13.0
# 13.0
HAFTA - 7 (9 Kasım 2017 Perşembe)
import numpy as np
import matplotlib.pyplot as plt

my_Numbers=np.random.randint(1,10,5)
my_Numbers #array([1, 4, 2, 3, 7])

myHistogram=[]
myHistogram #[]

for number in my_Numbers:
    for histItem in myHistogram:

        if(number==histItem[0]):
            histItem[1]=histItem[1]+1
        else:
            myHistogram.append(number,1)

myHistogram #[]

var_1=(1,2,3)
var_2=(2,5,3)
var_3=(1,5,3)
var_4=(2,5,6)

if var_1[2]==var_2[2]:
    print("1 ve 2'nin 3.değeri eşittir.")
else:
    print("1 ve 2'nin 3.değeri eşit değildir.")

if var_1==var_2:
    print("1 ve 2 eşittir.")
else:
    print("1 ve 2 eşit değildir.")
import numpy as np
import matplotlib.pyplot as plt
start=0
end=2
n=5
my_Numbers=np.random.randint(start,end,n)
img=plt.imread("")
myHistogram={}
my_Numbers #array([0, 1, 0, 1, 0])

for number in my_Numbers:
        if number in myHistogram.keys():
            myHistogram[number]=myHistogram[number]+1
        else:
            myHistogram[number]=1

my_Numbers, myHistogram, myHistogram[0]/myHistogram[1]
#histogram da iki değer olmalı
#(array([0, 1, 0, 1, 0]), {0: 3, 1: 2}, 1.5)
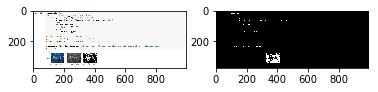
import matplotlib.pyplot as plt
import numpy as np
def convert_RGB_to_monochrome_BW(image_1):
threshold=100
img_1=plt.imread(image_1)
img_2=np.zeros((img_1.shape[0],img_1.shape[1]))
for i in range(img_2.shape[0]):
for j in range(img_2.shape[1]):
if (img_1[i,j,0]/3+img_1[i,j,1]/3+img_1[i,j,2]/3)>threshold:
# img_2[i,j]=img_1[i,j,0]/3+img_1[i,j,1]/3+img_1[i,j,2]/3
img_2[i,j]=1
else:
img_2[i,j]=0
# print(img_1.shape)
return img_2
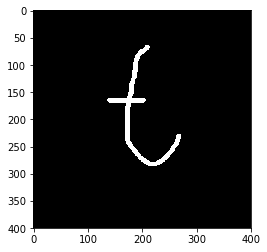
img_1 = convert_RGB_to_monochrome_BW(r"test_t_one.jpg")
plt.imshow(img_1, cmap="gray")
plt.show()
img_1.ndim, img_1.shape #(2, (400, 400))

i2 = img_1.reshape(1,img_1.shape[0]*img_1.shape[1])
i2.ndim, i2.shape #(2, (1, 160000))
def get_Histogram(image): #resim monochrome olmalı
    my_Histogram = {}
    for i in range(image.shape[0]):
        for j in range(image.shape[1]):
            item=image[i,j]
            if item in my_Histogram.keys():
                my_Histogram[item]=my_Histogram[item]+1
            else:
                my_Histogram[item]=1
    return my_Histogram

my_Histogram = get_Histogram(img_1)
my_Histogram #{0.0: 2936, 1.0: 157064}

x = my_Histogram[0.0]
y = my_Histogram[1.0]
print("Siyah-Beyaz Oranı: ", x/y) #Siyah-Beyaz Oranı: 0.01869301685936943
class myMatrix():
    def __init__(self,x,y):
        self.D=x
        self.F=y

def create_D_F(img_1):
    d = {(i,j) for i in range(img_1.shape[0])
               for j in range(img_1.shape[1])
               if img_1[i,j]==1
        }
    f = {(i,j):1 for i,j in d}
    m=myMatrix(d,f)
    return m

my_sparce_Matrix_1=create_D_F(img_1)
my_sparce_Matrix_1.D, my_sparce_Matrix_1.F
Sonuç: ({(266, 351), (109, 365), (381, 392), (312, 241), (185, 101), (5, 178), (171, 86), (104, 115), (157, 23), (30, 287), (284, 367), (323, 275), ...}, {(266, 351): 1, (109, 365): 1, (381, 392): 1, (312, 241): 1, (185, 101): 1, (5, 178): 1, (171, 86): 1, (104, 115): 1, (157, 23): 1, (30, 287): 1, (284, 367): 1, (323, 275): 1, ...})
HAFTA - 8 (23 Kasım 2017 Perşembe)
import csv
import random
import math

def loadCsv(filename):
    lines = csv.reader(open(filename, "r"))
    dataset = list(lines)
    for i in range(len(dataset)):
        dataset[i] = [float(x) for x in dataset[i]]
    return dataset

def splitDataset(dataset, splitRatio):
    trainSize = int(len(dataset) * splitRatio)
    trainSet = []
    copy = list(dataset)
    while len(trainSet) < trainSize:
        index = random.randrange(len(copy))
        trainSet.append(copy.pop(index))
    return [trainSet, copy]

def separateByClass(dataset):
    separated = {}
    for i in range(len(dataset)):
        vector = dataset[i]
        if (vector[-1] not in separated):
            separated[vector[-1]] = []
        separated[vector[-1]].append(vector)
    return separated

def mean(numbers):
    return sum(numbers)/float(len(numbers))

def stdev(numbers):
    avg = mean(numbers)
    variance = sum([pow(x-avg,2) for x in numbers])/float(len(numbers)-1)
    return math.sqrt(variance)

def summarize(dataset):
    summaries = [(mean(attribute), stdev(attribute)) for attribute in zip(*dataset)]
    del summaries[-1]
    return summaries

def summarizeByClass(dataset):
    separated = separateByClass(dataset)
    summaries = {}
    for classValue, instances in separated.items():
        summaries[classValue] = summarize(instances)
    return summaries

def calculateProbability(x, mean, stdev):
    exponent = math.exp(-(math.pow(x-mean,2)/(2*math.pow(stdev,2))))
    return (1 / (math.sqrt(2*math.pi) * stdev)) * exponent

def calculateClassProbabilities(summaries, inputVector):
    probabilities = {}
    for classValue, classSummaries in summaries.items():
        probabilities[classValue] = 1
        for i in range(len(classSummaries)):
            mean, stdev = classSummaries[i]
            x = inputVector[i]
            probabilities[classValue] *= calculateProbability(x, mean, stdev)
    return probabilities

def predict(summaries, inputVector):
    probabilities = calculateClassProbabilities(summaries, inputVector)
    bestLabel, bestProb = None, -1
    for classValue, probability in probabilities.items():
        if bestLabel is None or probability > bestProb:
            bestProb = probability
            bestLabel = classValue
    return bestLabel

def getPredictions(summaries, testSet):
    predictions = []
    for i in range(len(testSet)):
        result = predict(summaries, testSet[i])
        predictions.append(result)
    return predictions

def getAccuracy(testSet, predictions):
    correct = 0
    for i in range(len(testSet)):
        if testSet[i][-1] == predictions[i]:
            correct += 1
    return (correct/float(len(testSet))) * 100.0

def main():
    filename = 'pima-indians-diabetes.data.csv'
    splitRatio = 0.67
    dataset = loadCsv(filename)
    trainingSet, testSet = splitDataset(dataset, splitRatio)
    # print('Split {0} rows into train={1} and test={2} rows').format(len(dataset), len(trainingSet), # prepare model
    summaries = summarizeByClass(trainingSet)
    # test model
    predictions = getPredictions(summaries, testSet)
    accuracy = getAccuracy(testSet, predictions)
    print('Accuracy: ' + str(accuracy))

main() #Accuracy: 72.83464566929135
HAFTA - 9 (30 Kasım 2017 Perşembe)
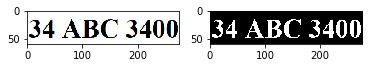
import matplotlib.pyplot as plt
import numpy as np
def convert_RGB_to_monochrome_BW(image_1):
threshold=200
img_1=plt.imread(image_1)
img_2=np.zeros((img_1.shape[0],img_1.shape[1]))
for i in range(img_2.shape[0]):
for j in range(img_2.shape[1]):
if (img_1[i,j,0]/3+img_1[i,j,1]/3+img_1[i,j,2]/3)>threshold:
img_2[i,j]=0
else:
img_2[i,j]=1
return img_2
def define_mask():
mask = [[1,1,1],[1,1,1],[1,1,1]]
for i in range(3):
for j in range(3):
print(mask[i][j], end=" ")
print()
return mask
def my_dilation(img_1, mask):
m=img_1.shape[0]
n=img_1.shape[1]
img_2 = np.random.randint(0,1,(m,n))
for i in range(1,m-1):
for j in range(1,n-1):
x_1 = img_1[i,j] and mask[1][1]
x_2 = img_1[i-1,j-1] and mask[0][0]
x_3 = img_1[i-1,j] and mask[0][1]
x_4 = img_1[i-1,j+1] and mask[0][2]
x_5 = img_1[i+1,j+1] and mask[2][0]
x_6 = img_1[i+1,j] and mask[2][1]
x_7 = img_1[i+1,j+1] and mask[2][2]
x_8 = img_1[i,j-1] and mask[1][0]
x_9 = img_1[i,j+1] and mask[1][2]
result_1 = x_1 or x_2 or x_3 or x_4 or x_5
result_2 = x_6 or x_7 or x_8 or x_9
result = result_1 or result_2
img_2[i,j]=result
return img_2
mask = define_mask()
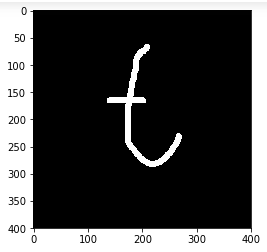
path = r"test_t_one.jpg"
image1 = convert_RGB_to_monochrome_BW(path)
image2 = my_dilation(image1, define_mask())
image3 = my_dilation(image2, define_mask())
plt.imshow(image1, cmap="gray"), plt.show()
plt.imshow(image2, cmap="gray"), plt.show()
plt.imshow(image3, cmap="gray"), plt.show()
HAFTA - 10 (14 Aralık 2017 Perşembe)
import matplotlib.pyplot as plt
import numpy as np
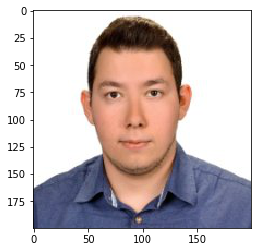
image = plt.imread("C:\\Users\\eraya\\Desktop\\JupyterExample\\q.jpg")
image.shape #(200, 200, 3)
plt.imshow(image)
plt.show()
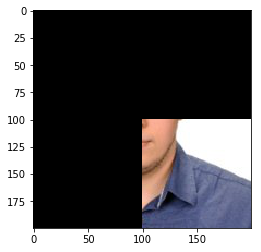
for i in range(image.shape[0]):
for j in range(image.shape[1]):
if(i < image.shape[0]/2):
image[i,j] = 0
if(j < image.shape[1]/2):
image[i,j] = 0
plt.imshow(image)
plt.show()
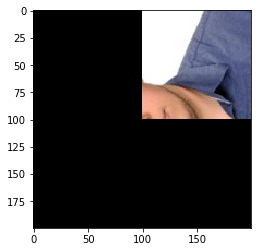
from scipy.misc import imrotate
derece = 90
new_image = imrotate(image, derece)
plt.imshow(new_image)
plt.show()
HAFTA - 11 (21 Aralık 2017 Perşembe)
#Rotate by Theta
import matplotlib.pyplot as plt
import numpy as np
import math

def get_image(path: str = u"C:\\Users\\eraya\\Desktop\\JupyterExample", file: str = u"a_1.png"):
    """
    :rtype: object
    """
    if ((path is None) or (file is None)):
        path = u"C:\\Users\\eraya\\Desktop\\JupyterExample"
        file = u"a_1.png"
    image_file_1 = path + u"\\" + file
    img_1 = plt.imread(image_file_1)
    plt.imshow(img_1)
    plt.show()
    return img_1

def get_rotation_matrix_for_angle(angle: float):
    theta = angle
    rotation_matrix = np.array([[math.cos(theta), -math.sin(theta)], [math.sin(theta), math.cos(theta)]], np.float)
    return rotation_matrix

def get_new_point(old_point: list, angle: float):
    old_point_i, old_point_j = old_point[0], old_point[1]
    rotation_matrix = get_rotation_matrix_for_angle(angle)
    point = np.array([old_point_i, old_point_j], np.float)
    point = point.reshape(2, 1)
    new_point = np.matmul(rotation_matrix, point)
    x = int(new_point[0])
    y = int(new_point[1])
    return [x, y]

def get_new_canvas_for_an_image(m: int, n: int, angle: float, dim: str = 3):
    old_corners = [[0, 0], [m, 0], [0, n], [m, n]]
    new_corners = []
    for p in old_corners:
        p_new = get_new_point(p, angle)
        new_corners.append(p_new)
        # print(p_new)
    y_min = min([y for x, y in new_corners])
    y_max = max([y for x, y in new_corners])
    y_min, y_max
    x_min = min([x for x, y in new_corners])
    x_max = max([x for x, y in new_corners])
    x_min, x_max
    m = int(abs(x_max - x_min))
    n = int(abs(y_max - y_min))
    img_2 = np.zeros((m, n, dim))
    return img_2

def get_rotated_image(image, angle: float):
    """
    :type angle: object
    """
    new_image_rotated = get_new_canvas_for_an_image(image.shape[0], image.shape[1], angle, image.ndim)
    offset_m = int((abs(new_image_rotated.shape[0] - image.shape[0])))
    offset_n = int((abs(new_image_rotated.shape[1] - image.shape[1])))
    rotation_matrix = get_rotation_matrix_for_angle(angle)
    for i in range(image.shape[0] - 15):
        for j in range(image.shape[1] - 15):
            new_point = get_new_point([i, j], angle)
            new_i = int(new_point[0] + offset_m)
            new_j = int(new_point[1] + offset_n)
            new_image_rotated[new_i, new_j, :] = image[i, j, :]
    return new_image_rotated

def get_new_coordinates(img, angle):
    new_coors = {}
    for i in range(img.shape[0]):
        for j in range(img.shape[1]):
            new_coors[(i, j)] = get_new_point([i, j], angle)
    return new_coors

def rotate_image_by_angle(image, angle):
    im_10 = image
    angle = angle
    result = get_new_coordinates(im_10, angle)
    x_min = min([result[xy][0] for xy in result])
    x_max = max([result[xy][0] for xy in result])
    y_min = min([result[xy][1] for xy in result])
    y_max = max([result[xy][1] for xy in result])
    im_11 = get_new_canvas_for_an_image(im_10.shape[0], im_10.shape[1], angle, im_10.ndim)
    plt.imshow(im_11)
    plt.show()
    for x in result:
        # x , result[x]
        if x_min < 0:
            new_i = result[x][0] + abs(x_min)
        else:
            new_i = result[x][0] + abs(x_min)
        if y_min < 0:
            new_j = result[x][1] + abs(y_min)
        else:
            new_j = result[x][1] + abs(y_min)
        if 0 < new_i < im_11.shape[0] and 0 < new_j < im_11.shape[1]:
            im_11[new_i, new_j, :] = im_10[x[0], x[1], :]
    plt.imshow(im_11)
    plt.show()
    a = 10
    return im_11

image = rotate_image_by_angle(get_image(), math.pi/2)
plt.imshow(image)
plt.show()
#Rotation Class
class RotateImage():
    import matplotlib.pyplot as plt
    def get_an_image_from_file(self,path=u"C:\\Users\\eraya\\Desktop\\JupyterExample", file=u"a_1.png"):
        """
        :rtype: object
        """
        image_file_1 = path + u"\\" + file
        img_1 = self.plt.imread(image_file_1)
        # plt.imshow(img_1)
        # plt.show()
        self.image=img_1
        return img_1

myRI=RotateImage()
myRI.get_an_image_from_file()
a=10
#Italic Letter Test
import matplotlib.pyplot as plt
import numpy as np
import math

def get_shear_matrix_for_factor_x(factor_x: int):
    shear_m=np.empty((2,2),np.float)
    shear_m[0,:] = np.array([1,factor_x])
    shear_m[1, :] = np.array([0,1])
    return shear_m

def get_rotation_matrix_for_angle(angle: float):
    theta = angle
    rotation_matrix = np.array([[math.cos(theta), -math.sin(theta)], [math.sin(theta), math.cos(theta)]], np.float)
    return rotation_matrix

def get_new_point(point: tuple, angle: float):
    """
    :param point:  a point in 2D, with coordinates x, y
    :param angle:  in radians
    :return: tuple representing a point with ratoted coordinates
    """
    rotation_matrix = get_rotation_matrix_for_angle(angle)
    point_vector=np.empty((2,1),float)
    point_vector[0,0]=point[0]
    point_vector[1,0]=point[1]
    new_point = np.matmul(rotation_matrix, point)
    x = int(new_point[0])
    y = int(new_point[1])
    return (x,y)

def display_plot(points):
    """
    :param points: np.matrix
    """
    point_list_x = points[:, 0]  #
    point_list_y = points[:, 1]  # [
    plt.plot(point_list_x, point_list_y)
    plt.show()

def get_my_T():
    points=np.empty((9,2),np.float)
    points[:,0] = np.array([20,25,25,35,35,10,10,20,20])
    points[:,1] = np.array([ 0, 0,30,30,35,35,30,30, 0])
    return points

def display_three_letters_on_same_plot(p_1: np.matrix , p_2: np.matrix, p_3: np.matrix):
    plt.plot(p_1[:,0], p_1[:,1],color="red")
    plt.plot(p_2[:, 0], p_2[:, 1], color="yellow")
    plt.plot(p_3[:, 0], p_3[:, 1], color="green")
    plt.xlim([-100,100])
    plt.ylim([-100,100])
    plt.show()

def display_two_letters_on_same_plot(p_1: np.matrix , p_2: np.matrix):
    plt.plot(p_1[:,0], p_1[:,1],color="red")
    plt.plot(p_2[:, 0], p_2[:, 1], color="yellow")
    plt.show()

def display_points(points):
    plt.plot(points[:,0], points[:,1])
    plt.show()

def rotate_a_letter_by_angle(letter:np.matrix,angle:np.float):
    m,n=letter.shape
    new_points = np.empty((m,n),np.float)
    for i in range(m):
        new_points[i,:] = get_new_point(letter[i,:],angle)
    return new_points

def shear_a_letter_by_factor_x(letter:np.matrix,factor_x:np.int):
    m,n=letter.shape
    new_letter = np.empty((m,n),np.float)
    shear_matrix=get_shear_matrix_for_factor_x(factor_x)
    for i in range(m):
        new_letter[i,:] = np.matmul(shear_matrix,letter[i,:])
    return new_letter

p=get_my_T()
p_1=rotate_a_letter_by_angle(get_my_T(), np.pi/2)
p_2=shear_a_letter_by_factor_x(p,1)
# display_two_letters_on_same_plot(p,p_2)
display_three_letters_on_same_plot(p,p_1,p_2)
# display_points(p_2)